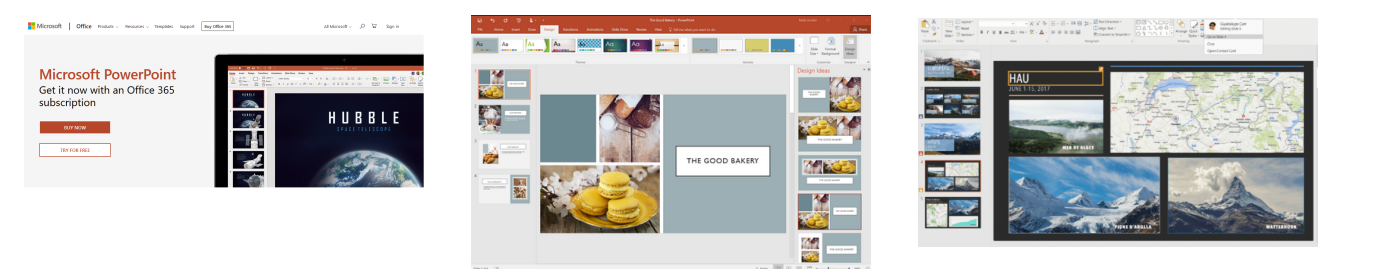
Introducing Microsoft PowerPoint®
Microsoft PowerPoint is a powerful yet easy-to-use software application for creating professional-looking slide shows. It is a standard component of the company’s Microsoft Office suite software, and is bundled together with Word, Excel and other Office productivity tools.
Contents
- About Presentation Software
- Images and Graphics
- Tables and Charts
- Transitions and Animation
- Speaker Notes and Handouts
About Presentation Software
When you demonstrate a new product, describe the results of your research, or announce a new organisational structure, you typically make a speech. Two things can help your speech to have a greater impact:
- Visual Aids: To grab your audience’s attention, and reinforce your messages, you could show them a variety of visual aids while you are talking.
- Handouts: To ensure that your audience retains key information, you could give them handouts to take away and study afterwards.
Presentation software such as Microsoft PowerPoint can help you to design and produce the visual aids and the printed handouts. PowerPoint can help you get your ideas across with beautiful design, rich animation, cinematic motion, 3D models and icons. Unfortunately, it doesn’t help you with the speech!
Slides
The basic building blocks of a presentation are called slides. When you create a new presentation, PowerPoint automatically creates a single new slide. You insert further slides individually. PowerPoint always inserts a new slide after the currently displayed one. The first slide in any PowerPoint presentation is always the title slide. It introduces your presentation to the audience. Like the first page of a book, it usually has a different layout from the rest of the presentation.
You can move forward and backward through a presentation, one slide at a time, by pressing the PAGE DOWN and PAGE UP keys. Press HOME to go to the very first slide, and END to go to the last slide.
AutoLayouts and placeholders
When you create a new slide, you can choose from dozens of ready-made slide layouts called AutoLayouts. One layout, called the Title layout, is designed for the first or title slide of a presentation. The AutoLayout feature will resize and reposition your slide content to match the corresponding slide layout.
Each slide layout contains one or more boxes called placeholders, within which you type and edit.
Views of your presentation
PowerPoint offers a number of views – ways of looking at your slides. In the default Normal view, the screen is split into three panes: a Normal pane (where you work with one slide at a time), an Outline pane (where you see work with the text of all slides) and a Notes pane (where you can work with additional text for the presenter). You can adjust the size of the different panes by clicking on and then dragging the pane borders.
Bullet points and alignment
Except for the title slide, the text on PowerPoint slides typically consists of bullet points — a bullet character followed by one or a few words of text. Bullet characters can be sequentially increasing numbers (1, 2, 3, …) or letters (a, b, c, …). By default, PowerPoint centre-aligns text on title slides, and left-aligns text on all other slides. You can override these defaults on individual slides by using the alignment options.
Images and Graphics
You can illustrate your PowerPoint slides by inserting pictures – drawings created in other software applications or scanned photographs. PowerPoint includes a gallery of clip art pictures that you can use in different presentations. You can move, resize or delete an imported picture as you would any other object, and place borders and shadows around them.
The graphics that you can draw on PowerPoint slides include simple shapes such as lines, arrows, rectangles, circles and ellipses. AutoShapes are commonly-used, ready-made shapes that you can insert in your presentations. AutoShape categories include lines, basic shapes, flowchart elements, stars and banners, and callouts.
You can change the shape, size, position and colour of simple graphics and AutoShapes. You can rotate them, flip them, and add shadows behind them. You can also group them so that you can work with them as if there were a single object.
Text Boxes
A text box is a text placeholder that you insert directly on a slide. You can change the format and alignment of text in a text box in the same way as you would text in a placeholder that is part of an AutoLayout.
You can use text boxes to position text wherever you want, annotate a chart or image, or place an announcement on a slide. You can even create a vertical text box in which the text reads from top to bottom instead of left to right, or convert a text box into a circle, arrow, or other shape.
Tables and Charts
You can create a table on a slide with a selected number of rows and columns, enter numbers and text headings, and apply formatting to it.
You can present quantitative (number-based) information in a variety of chart types, such as bar, column and pie charts. PowerPoint chart-creating tool includes a datasheet (a small spreadsheet into which you can type your own text and numbers) and chart menus with relevant spreadsheet-like commands. Your chart changes as you modify the contents of the datasheet. You can change the colour or format of any element in the chart (such as a column in a column chart, the chart axes or the chart legend) by double-clicking on it, and choosing an option from the menu displayed.
Organisation charts are used to illustrate people’s positions within an organisation or the structure of components within a physical system or process. Such charts consist of boxes (for representing people or components) and lines (for representing their relationships). PowerPoint’s organisation chart tool provides a customisable chart template, with boxes arranged in a hierarchal structure.
Transitions and Animation
A transition is a graphic effect that controls how one slide replaces another – for example, the new slide could appear to drop down from the top of the screen. You can control the speed with which PowerPoint runs your selected transition effect, and link a sound to the transition between slides.
An animated slide is one on which the elements are revealed gradually rather than all at once. These can help the presenter focus the audience’s attention on each point in turn.
PowerPoint offers a set of ready-to-go preset animations, some with associated sound effects, which you can quickly apply to your slides. You can customise preset animations as required. Options that you can modify include the order in which a slide’s elements appear, the direction from which they appear, and the way that previous elements are dimmed.
Animated elements can be bullet points, graphics such as lines or boxes, inserted pictures, and charts. You can also animate charts themselves, so that chart elements, such as the columns in a column chart, are displayed progressively rather than all at once.
Speaker Notes and Handouts
For each slide that you create in a presentation, PowerPoint creates what it calls a speaker notes page. You can ignore or use these pages as you wish. Typically, you use speaker notes pages to remind you (or whoever is giving the presentation) of key points or background information. You can enter or alter text in speaker notes pages at any stage when creating or editing your presentation.
PowerPoint gives you the option of producing printed handouts for your audience, in which two, three, four, six, or nine slides are shown to a page. PowerPoint’s print options enable you to print one, all or a range of slides, handouts, speaker notes or the outline.
Powerpoint: A short history
PowerPoint was originally developed by Dennis Austin and Thomas Rudkin at Forethought Inc in 1987. In August of 1987, Microsoft bought Forethought for $14 million and transformed the company into Microsoft’s graphics business division, where the company continued to develop the software. The first version of PowerPoint under the Microsoft name was launched with Microsoft Windows 3.0 in 1990.